
VPS Tutorials
VPS Traffic Monitoring and Over-Quota Alerts (2026): vnStat, iftop, nload Monthly Traffic Checklist
VPS plans say 1TB, 3TB, or 10TB monthly traffic, but many people only find out they've gone over when they get throttled or receive a bill. This article uses vnStat for monthly traffic accounting, nload and iftop to investigate real-time anomalies, and provides 80%/90% threshold alert scripts. Suitable for small sites, proxies, download services, and self-hosted apps.
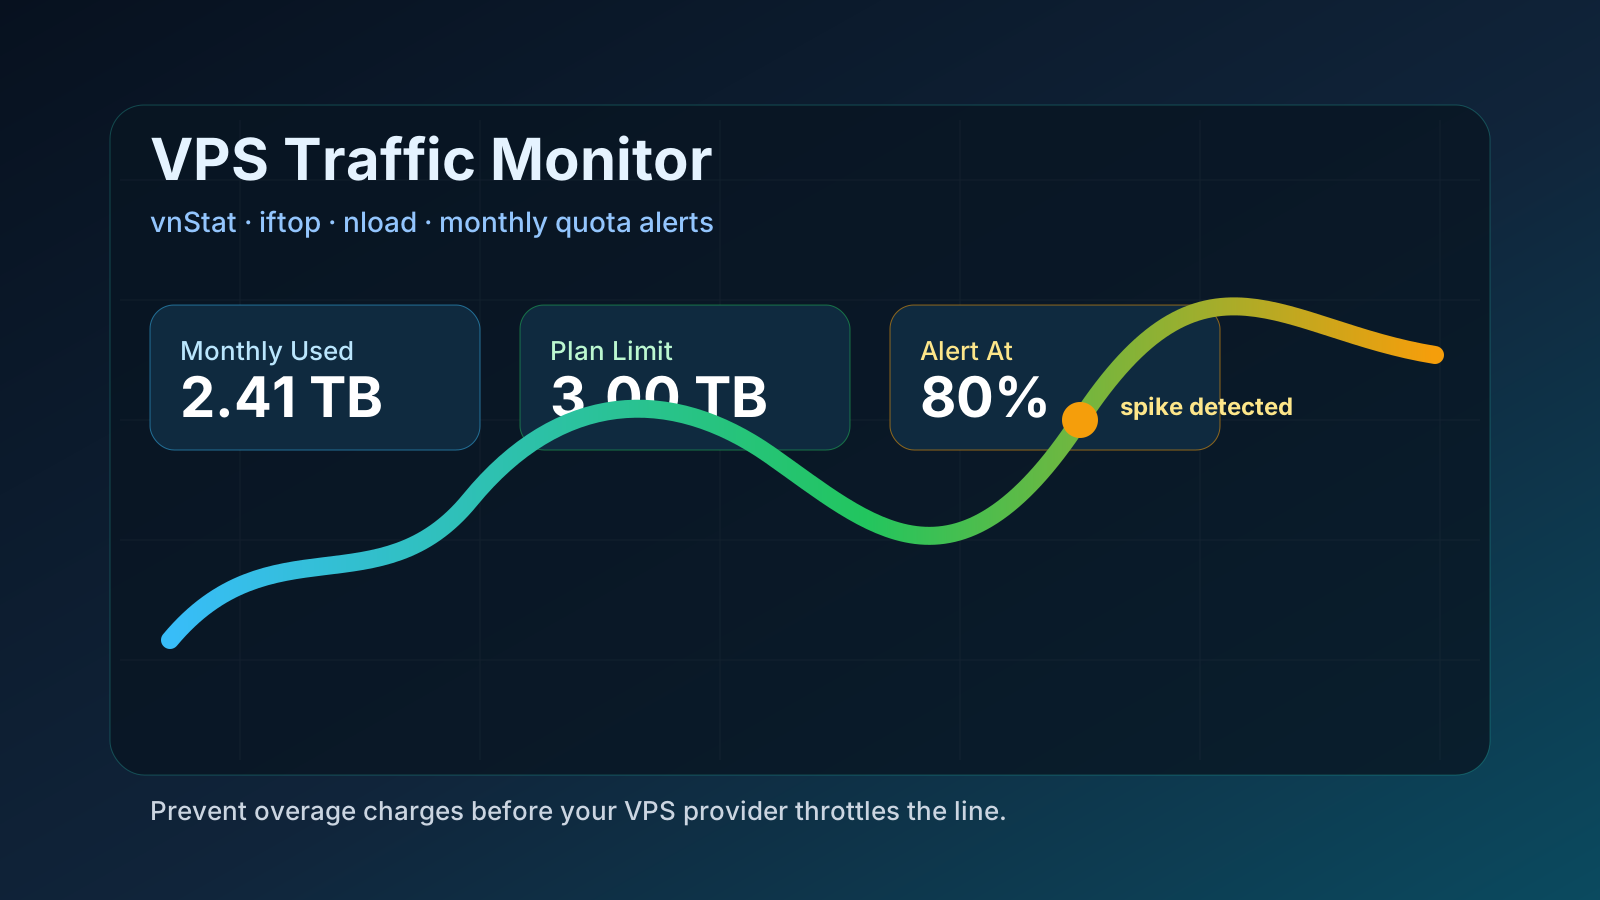
Many VPS plans advertise "1TB monthly traffic," "3TB bandwidth package," "throttled after exceeding," or "unlimited traffic." The problem is: statistics in the provider's panel are often delayed, and by the time you actually notice you've gone over, you may already have been throttled, suspended, or charged extra.
If you just want to know "is 1Mbps enough," you can first read our VPS bandwidth and traffic calculation guide. If you're already running a website, proxy, downloads, object storage sync, monitoring dashboards, n8n, Dify, or an API gateway, this article is more suitable for you: it solves "how to automatically know every day how much traffic you've used, and when to stop."
Many beginners confuse bandwidth and traffic:
| Metric you see | What it represents | Best tool |
|---|---|---|
| Current upload/download speed | How much data is moving per second right now | nload |
| Which connection is consuming traffic | Which IP or connection is most active | iftop |
| How much used today and this month | Whether you're approaching the plan limit | vnStat |
| Application, CPU, disk, service status | Overall observability | Prometheus / Grafana |
We already have a Prometheus + Grafana monitoring and alerting solution, which is a more complete professional monitoring setup. What this article recommends is a lighter approach: first get a clear picture of monthly traffic, then decide whether to deploy a bigger system.
My recommendation is simple:
- Install
vnStaton all VPS to record daily and monthly traffic long-term. - When you suspect traffic has suddenly increased, use
nloadto see real-time speed. - When you're still not sure who is consuming traffic, use
iftopto find the connection source. - Set two-level alerts at 80% and 90% of monthly traffic.
- If it's a pay-as-you-go cloud server, also add budget alerts and a cap policy.
The benefits are low cost, low resource usage, and a clear troubleshooting path. Even a 1-core 512MB small instance can run it, and you don't need to deploy a large monitoring stack just to watch traffic.
First check what your public network interface is called:
ip -br addr
Common results might be:
lo               UNKNOWN        127.0.0.1/8 ::1/128
eth0             UP             203.0.113.10/24
ens3             UP             203.0.113.10/24
The examples below assume the interface is eth0. If your machine shows ens3, enp1s0, or another name, just replace eth0 in the commands.
Debian / Ubuntu:
sudo apt update
sudo apt install -y vnstat
sudo systemctl enable --now vnstat
AlmaLinux / Rocky Linux / Fedora:
sudo dnf install -y vnstat
sudo systemctl enable --now vnstat
After initialization, check:
vnstat -i eth0
vnstat -d -i eth0
vnstat -m -i eth0
You'll see something like:
rx      /      tx      /     total
1.12 TiB /  340 GiB    /   1.45 TiB
Two details to note here:
rxis inbound traffic,txis outbound traffic; different providers have different billing rules—some only count outbound, some count both directions.- Right after installing
vnStat, there's no historical data; it usually takes a few minutes to a few hours to get stable statistics.
If your plan is 3TB monthly traffic, I recommend calculating conservatively yourself: add both inbound and outbound together. That way, even if the provider's rules are more lenient, you won't underestimate the risk.
Install:
sudo apt install -y nload
Run:
nload eth0
It shows current incoming/outgoing speed. Good for answering questions like:
- Is the website being hammered by crawlers?
- Is a backup job still uploading?
- Is some Docker container syncing like crazy?
- Is a proxy or download service maxing out the egress?
If you only see abnormal monthly traffic but current nload shows no obvious speed, the problem may have already passed, and you need to check logs, scheduled tasks, or historical backup records.
Install:
sudo apt install -y iftop
When running, I recommend adding -n to avoid DNS reverse lookups slowing down the interface:
sudo iftop -n -i eth0
You'll see which IPs in current connections are uploading/downloading the most. Common judgments:
- Many unfamiliar IPs accessing 80/443: could be crawlers, CC attacks, hotlinking, or API abuse.
- A single internal/object storage address with very high traffic: could be backups, sync, or image pulls.
- Some overseas IP occupying egress for a long time: check whether there are proxy, download, transcoding, or AI model pull tasks.
If you find the website is under attack, you can refer to What to do when a VPS website is hit by CC attacks. If Docker logs, images, or volumes are out of control, you can also read Troubleshooting Docker filling up the disk; many times disk and traffic issues appear together.
The script below is suitable for minimal scenarios: run once a day, output warning when over 80%, output critical when over 90%. You can route the output to email, Telegram Bot, WeCom Webhook, or your own monitoring system.
Create the script:
sudo nano /usr/local/bin/vps-traffic-alert.sh
Fill in:
#!/usr/bin/env bash
set -euo pipefail

IFACE="eth0"
LIMIT_GB="3000"
WARN_PERCENT="80"
CRIT_PERCENT="90"

MONTH_TOTAL_GB=$(vnstat -i "$IFACE" --oneline b | awk -F';' '{print $11}' | awk '{print $1}')
USED_PERCENT=$(awk -v used="$MONTH_TOTAL_GB" -v limit="$LIMIT_GB" 'BEGIN { printf "%.0f", used / limit * 100 }')

MESSAGE="VPS traffic usage: ${MONTH_TOTAL_GB}GB / ${LIMIT_GB}GB (${USED_PERCENT}%) on ${IFACE}"

if [ "$USED_PERCENT" -ge "$CRIT_PERCENT" ]; then
  echo "CRITICAL: $MESSAGE"
  exit 2
fi

if [ "$USED_PERCENT" -ge "$WARN_PERCENT" ]; then
  echo "WARNING: $MESSAGE"
  exit 1
fi

echo "OK: $MESSAGE"
Make executable and test:
sudo chmod +x /usr/local/bin/vps-traffic-alert.sh
/usr/local/bin/vps-traffic-alert.sh
Then create a systemd timer or cron. Simple cron example:
sudo crontab -e
Check once a day at 9 AM:
0 9 * * * /usr/local/bin/vps-traffic-alert.sh >> /var/log/vps-traffic-alert.log 2>&1
If your plan is 1TB, change LIMIT_GB="3000" to LIMIT_GB="1000". If the provider only counts outbound traffic, you can further modify the script to read only tx, but at the beginner stage I recommend conservatively looking at the total.
In the following situations, don't just think about cleaning up traffic:
- Exceeding 70% of the plan for two consecutive months means growth is no longer occasional.
- Having to manually stop services every end of month means the plan doesn't match the business.
- The provider throttles directly to 1Mbps after exceeding the threshold, affecting online service availability.
- Your traffic mainly comes from static files, images, or download packages—you should consider object storage or CDN.
- Your business is streaming media, download sites, or large file distribution—you should prioritize buying a large-traffic plan rather than an ordinary small instance.
If you're wondering why outbound traffic is expensive, you can read Explanation of overseas VPS outbound traffic costs. If you use a pay-as-you-go cloud server, be sure to read How to prevent runaway bills on pay-as-you-go cloud servers.
Misconception 1: If the provider says unlimited traffic, you don't need monitoring.
Many "unlimited traffic" plans still have fair use clauses, and after exceeding some hidden threshold you may be throttled or asked to upgrade. We also have a dedicated explanation: Is unlimited traffic VPS really unlimited.
Misconception 2: Only look at the panel, not the server's local statistics.
The provider panel is the final authority, but it may be delayed; local statistics can detect anomalies faster. When the two disagree, the provider's bill prevails, but use local data for alerts.
Misconception 3: Reinstall the system as soon as you see high traffic.
First use iftop, Nginx logs, and Docker logs to locate the source. Reinstalling loses evidence and may not fix the root cause.
Misconception 4: Only monitor CPU and memory.
Many small sites go down not because of insufficient CPU, but because bandwidth is being hammered, traffic is exhausted, or egress is throttled. Traffic monitoring should be part of basic inspection alongside disk, certificates, and service status.
- Use
ip -br addrto find the public network interface name. - Install and enable
vnStat. - Check
vnstat -m -i eth0weekly. - Install
nloadto see real-time speed when anomalies occur. - Install
iftopto find connection sources when anomalies occur. - Set 80% and 90% alert thresholds according to your plan.
- When monthly traffic consistently exceeds 70%, consider upgrading, migrating, adding CDN, or splitting static resources.
VPS traffic monitoring doesn't need a complex platform from the start. For most personal sites, small teams, and self-hosted services, vnStat + nload + iftop + 一个阈值脚本 already solves 80% of the problem.
The real key is: don't wait until the provider throttles you or the bill arrives to start investigating. As long as you know how much you've used this month, where abnormal traffic comes from, and when thresholds will be triggered, you can decide in advance whether to throttle, add caching, migrate static resources, or switch to a more suitable VPS plan.